
Your numbers, finally readable
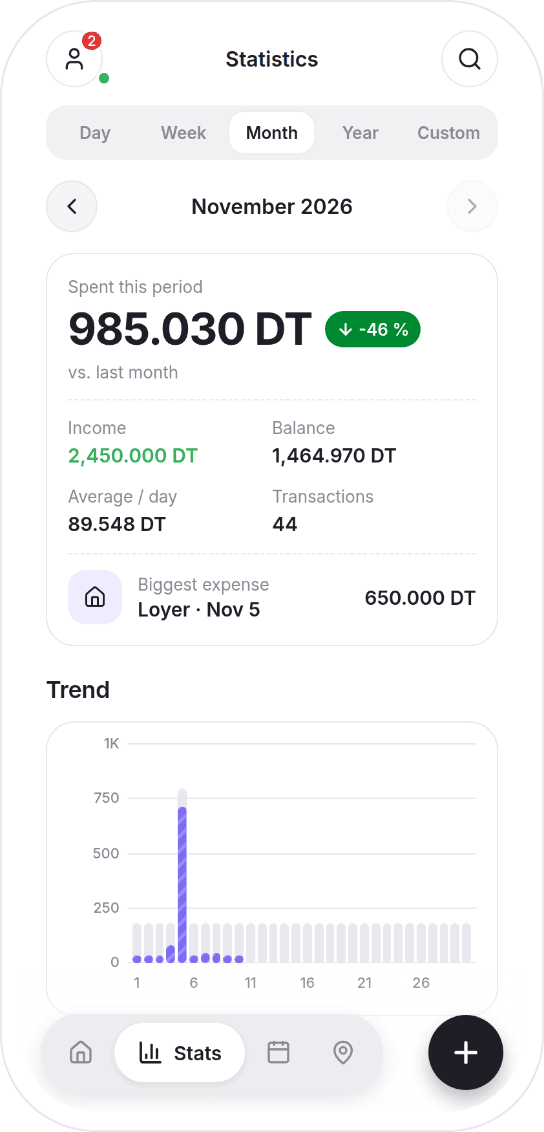
Statistics
Simple charts to understand your spending and anticipate the end of the month.
Every period
Day, week, month, year or custom range.
Comparisons
“+12% vs last week”: trends at a glance.
Forecast
Projected end-of-month balance at your current pace.
Habits
The yearly cost of every habit, from coffee to taxis.
Other features
Ready to know where your money goes?
Download Pennoway, the free expense tracker app for Android.